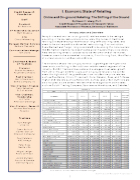
                                  Credit Research Foundation
Staff President
Bill Balduino
VP Research & Education
Matt Skudera
CFO
Cheryl Weaverling
Manager Member Services
Barbara Clapsadle
Communications Manager
Tom Diana
  Chairman & Board of Trustees
Chairman
Sharon Nickerson Acushnet Company
Past Chairman
Marty Scaminaci Bemis Company Inc
Vice-Chairman, Finance
Frank Sebastian SLD of adidas
Vice-Chairman, Membership Art Tuttle American Greetings
Vice-Chairman, Research
Michael Bevilacqua PepsiCo
Trustees
Kurt Albright Uline Inc
Dawn Burford InSinkErator (an Emerson Company)
Paul Catalano ABC Amega
Peter Knox Nestle USA
Abigail Ledger Avery Dennison
Jackie Mulligan Proctor & Gamble Distributing LLC
 I. Economic State of Retailing
Online and On-ground Retailing: The Shifting of the Ground
By Steven C. Isberg, Ph.D
Credit Research Foundation Sr Research Fellow Associate Professor of Finance, University of Baltimore
Introduction and Overview
Many bricks and mortar (or on-ground) retailers seem to be taking a pounding in the markets and economy lately. Big names in traditional retailing are experiencing the effects of long term declining sales, and seem to be on the path to substantial restructuring, if not extinction.
Even Walmart and Target, long considered to be among the more resilient middle market retailers, have seen sales growth substantially slow down. Retailers serving what is considered to be the lower end of the market, however, seem to be somewhat immune to, if not thriving from, the effects of current economic and social conditions.
The evidence shows that on-ground retail is growing at the higher and lower ends, and falling in the traditional middle market segment of the industry. Exhibit 1 below shows sales and average annual sales growth from 2012 through 2016 for a group of on-ground retailers. As can be seen, the high end of the growth spectrum includes low price retailers such as Five Below, Ollie’s, Pricesmart, Dollar General, Ross, and TJ Maxx. Higher end retailers such as Nordstrom, Zumiez, and Urban Outfitters are also included, as are several retailers that have significant online sales, such as Duluth Trading Company, Sportsmans Warehouse, and Cabelas.1
 Exhibit 1
 Sales ($MM) and Average Annual Sales Growth for Selected Bricks and Mortar Retailers: 2012-2016
 Company
FIVE BELOW INC
DULUTH HOLDINGS INC OLLIE'S BARGAIN OUTLET SPORTSMANS WAREHOUSE PRICESMART INC
DOLLAR GENERAL CORP DICKS SPORTING GOODS INC CABELAS INC
ROSS STORES INC
TJX COMPANIES INC
URBAN OUTFITTERS INC ZUMIEZ INC
NORDSTROM INC
COSTCO WHOLESALE HIBBETT SPORTS INC
BIG 5 SPORTING GOODS CORP WAL-MART STORES INC OFFICE DEPOT INC
GAP INC
KOHL'S CORP
PENNEY (J C) CO
BIG LOTS INC
DILLARDS INC
TARGET CORP
MACY'S INC
BON-TON STORES INC
STAGE STORES INC
BUCKLE INC
WAL MART DE MEXICO SA
  2012
$ 418.83
$ $ $ $ $ $ $ $ $ $ $ $ $ $ $ $ $ $ $ $ $ $ $ $ $ $ $ $ $
535.40 163.09 540.72 643.16
2013
2,299.81 17,504.16 6,213.17 3,703.46 10,230.35 27,422.69 3,086.61 724.34 12,540.00 102,870.00 851.97 993.62 476,294.00 11,242.00 16,148.00 19,031.00 11,859.00 5,124.76 6,691.78 71,279.00 27,931.00 2,834.06 1,609.48 1,128.00 32,460.02
  $ $ $ $ $ $ $ $ $ $ $ $ $ $ $ $ $ $ $ $ $ $ $ $ $ $ $ $ $
680.22 231.87 637.98 660.00
2014
2,517.57 18,909.58 6,814.48 3,773.74 11,041.68 29,078.40 3,323.08 811.55 13,506.00 110,212.00 913.49 977.86 485,651.00 16,096.00 16,435.00 19,023.00 12,257.00 5,177.08 6,780.13 72,618.00 28,105.00 2,822.90 1,638.57 1,153.14 29,897.47
$ $ $ $ $ $ $ $ $ $ $ $ $ $ $ $ $ $ $ $ $ $ $ $ $ $ $ $ $
831.95 304.16 762.37 706.76
2015
2,802.60 20,368.56 7,270.97 4,151.65 11,940.00 30,944.93 3,445.13 804.18 14,437.00 113,666.00 943.10 1,029.10 482,130.00 11,727.00 15,797.00 19,204.00 12,625.00 5,190.58 6,754.55 73,785.00 27,079.00 2,789.50 1,604.43 1,119.62 27,677.26
 $ $ $ $ $ $ $ $ $ $ $ $ $ $ $ $ $ $ $ $ $ $ $ $ $ $ $ $ $
2016
1,000.41 376.12 890.32 779.96 2,904.75 21,986.59 7,921.98 4,365.20 12,866.76 33,183.74 3,545.79 836.27 14,757.00 116,073.00 972.96 1,021.24 485,338.00 11,021.00 15,516.00 18,686.00 12,547.00 5,200.44 6,418.01 69,495.00 25,778.00 2,674.35 1,442.72 974.87 25,822.57
 Ave Ann Growth
24.32% 23.23% 13.28% 10.30%
9.17% 8.23% 7.94% 7.89% 7.26% 6.41% 6.13% 5.72% 5.01% 4.57% 4.41% 2.08% 0.88% 0.75%
-0.22% -0.78% -0.85% -0.94% -1.26% -1.32% -1.77% -2.66% -3.24% -3.50% -5.06%
$ $ $ $ $ $ $ $ $ $ $ $ $ $ $ $ $ $ $ $ $ $ $ $ $ $
526.94 2,045.16 16,022.13 5,836.12 3,222.03 9,721.07 25,878.37 2,794.92 669.39 12,134.00 97,062.00 818.70 940.49 468,651.00 10,695.65 15,651.00 19,279.00 12,985.00 5,400.12 6,751.60 73,301.00 27,686.00 2,978.84 1,645.80 1,124.01 31,786.18
                                     ABERCROMBIE & FITCH $ 4,510.81 $ 4,116.90 $ 3,744.03 $ 3,518.68 $ 3,326.74 -7.33% SEARS HOLDINGS CORP $ 39,854.00 $ 36,188.00 $ 31,198.00 $ 25,146.00 $ 22,138.00 -13.67%
1  Data Sources: Standard and Poor’s Research Insight
     2
©2017 Credit Research Foundation