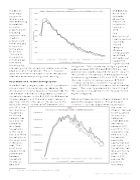
                                Exhibit 5
Number of Households in Each Income Category: Less than $5,000 to $200,000: 2012 and 2015
  8,000 7,000 6,000 5,000 4,000 3,000 2,000 1,000
0
Under $5,000
$35,000 to $39,999
$70,000 to $74,999
2012 Number 2015 Number
          $105,000 to $109,999
$140,000 to $144,999
$175,000 to $179,999
   In addition, most major on-ground retailers are now attempting to establish
an online
presence with
shopping
opportunities
in which
products are
either shipped
to home or
to the store
for pickup.
The ship to
store option
almost always
eliminates
the shipping
charges, giving the on-ground retailer a potential edge over an online retailer. This still, however, does not eliminate the need to cover the physical overhead expenses of on-ground retailing.
Household and Income Demographics
A predominantly large number of U.S. households occupy lower income categories, skewing the distribution of income heavily to the downside. As can be seen in Exhibit 5, the greatest number of households appear in the $20,000-24,999 annual income category, and the size of each category declines from that interval, all the way out to the
6
and $85,000, which is still somewhat above the median US household income in 2016.
The distribution of total household income by income category shows a
similar pattern, yet shifted somewhat out toward the higher income
categories. Total income per category generally peaks between $75,000 and $105,000 per year, and declines steadily beyond that point. As with the number of households, there appears to be some pivoting between 2012 and 2015, in which the total income for categories over $75,000
is higher, while total income for households under $75,000 is about the same, not somewhat lower. This is partly explained by the shifting of the number of households from the lower to the higher categories.
Adjusting these trends for inflation between 2012 and 2015 changes the story. As can be seen
in Exhibit 7, (on next page) when adjusting for
the impact of inflation, the real total household income in all categories under $80,000 decreased between 2012 and 2015. This represents over 64% of all U.S. households, essentially saying that well over half of U.S. households had less purchasing power in 2015 than in 2012, even as the economy recovered.
 $200,000 annual income level.5 Between 2012 and 2015, the
distribution of
households
by income category has also pivoted somewhat, with fewer households
at the lower end, and more households at the upper end in the latter year. The pivot point appears to be somewhere between household income of $60,000
   $300,000,000.00
$250,000,000.00
$200,000,000.00
$150,000,000.00
$100,000,000.00
$50,000,000.00
$-
Under $5,000
$35,000 to $39,999
total Income 2012
$175,000 to $179,999
Exhibit 6
Total Income per Income Category: <$5,000 to $200,000: 2012 and 2015
        $70,000 to $74,999
$105,000 to $109,999 Total Income 2015
$140,000 to $144,999
    6  Data source: United States Census Bureau, 2016
5
©2017 Credit Research Foundation
$M
Households in M's