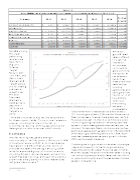
                                          Exhibit 2
  Sales ($MM) and Average Annual Sales Growth for Selected Online Retailers: 2012-2016
 Company
VIPSHOP HOLDINGS LTD WAYFAIR INC AMAZON.COM INC
FTD COMPANIES INC OVERSTOCK.COM INC HSN INC
 2012
$ 692.11
$ 61,093.00 $ 613.51 $ 1,099.29 $ 3,266.74
 2013
$ 1,696.67 $ 915.84 $ 74,452.00 $ 627.34 $ 1,304.22 $ 3,403.98
  2014
$ 3,773.66
$ 1,318.95
$ 88,988.00
$ 640.51
$ 1,497.10
$ 3,583.03
2015
$ 6,206.31 $ 2,249.89 $ 107,006.00 $ 1,219.75 $ 1,657.84 $ 3,690.58
 2016
$ 8,150.84 $ 3,380.36 $ 135,987.00 $ 1,122.00 $ 1,799.96 $ 3,567.49
  Ave Ann Growth
85.25% 54.54% 22.15% 16.29% 13.12%
    2.23%
                  CAFEPRESS INC GAIA INC
Notable among the lower performing retailers are Gap, Kohl’s, Big Lots, Dillards, Target, Macy’s, Bon- Ton, A&F, and Sears. Even Walmart and Target stores are not seeing substantial growth over the past
five years. Walmart’s sales actually declined in 2015, as did Target’s in 2016.
There are a number of key factors responsible for these recent trends. This article will examine several, including the role of internet, or e-commerce retailing, shifting age and income demographics, and consumer credit trends.
E-commerce
Internet retailing has gained strength continuously in the 21st century. While just 1.24% of total retail sales in 2000, e-commerce sales have grown to 9.5% of that volume. Exhibit 2 provides the sales and average annual growth rates for a selected group of internet retailers, including Amazon. As can be seen, some of the growth has been striking, although the evidence shows that simply being an online retailer does
$ 217.79 $ 245.86 $ 132.05 $ 104.51 $ 102.21 -17.23% $ 202.48 $ 155.46 $ 166.69 $ 13.46 $ 17.25 -45.98%
        1200
1000
800
600
400
200
0
2000 2001 2002 2003 2004 2005 2006 2007 2008 2009 2010 2011 2012 2013 2014 2015 2016 Index of Real E-commerce Index of Real Retail
125
120
115
110
105
100
95
90
Exhibit 3
Indices of Real (2000=100) U.S. Retail (Ex Auto) and E-Commerce Sales: 2000-2016
          1 not guarantee success.2
While on- ground retail sales suffered through the recession, online sales continued to grow with minor interruption. As can be seen in Exhibit 3, an index of real retail sales (without including automobiles and parts) grew from 100.00 to 117.37 from 2000 to 2007. Over
the following two years, it plummeted to
108, and has now increased back to a level of about
122, for a net gain of about 22% over the 16 year period. Real internet sales, however, have grown over ten-fold. As can also be seen in Exhibit 3, e-commerce retailers lost nothing during the recession, and the growth rate appears to be increasing almost exponentially over the course of the recovery. Real e-commerce retailing has grown at an average annual rate of over 13% since 2009, while real on-ground have grown at only 1.56%, much less than the average annual rate of growth in the real GDP over the same time period.
Combining real on-ground and online sales into a single index and comparing it to that for on-ground alone makes this point even clearer. As can be seen in Exhibit 4 (on next page), the pace of overall retail sales including the internet is growing at a much faster rate than that for on-ground retailing alone, and the gap between the two appears to be widening.
   2  Ibid.
3
©2017 Credit Research Foundation
Index of E-Commerce Sales (2000=100)
Index of Retail Sales (2000=100)